Opening the book…
Trophic interactions in a community can be represented by diagrams called food chains and food webs. Energy flows through a community as a result of trophic interactions.
Energy Flow
Cells run on the chemical energy found mainly in carbohydrate molecules, and the majority of these molecules are produced by one process: photosynthesis. Through photosynthesis, certain organisms convert solar energy (sunlight) into chemical energy, which is then used to build carbohydrate molecules (figure \(\PageIndex{a}\)). The energy that is harnessed from photosynthesis enters the communities continuously and is transferred from one organism to another. Therefore, directly or indirectly, the process of photosynthesis provides most of the energy required by living things on Earth.
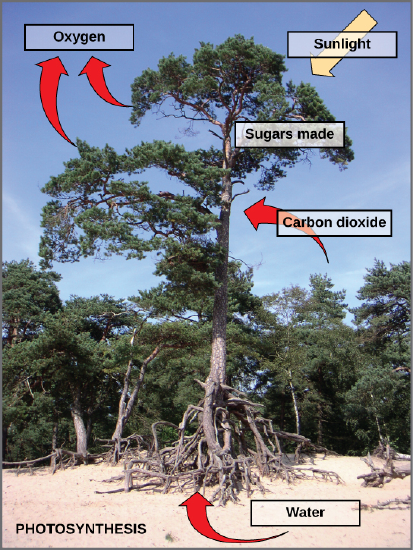
Organisms that conduct photosynthesis (such as plants, algae, and some bacteria), and organisms that synthesize sugars through other means are called producers. Without these organisms, energy would not be available to other living organisms, and life would not be possible. Consumers, like animals, fungi, and various microorganisms depend on producers, either directly or indirectly. For example, a deer obtains energy by eating plants. A wolf eating a deer obtains energy that originally came from the plants eaten by that deer (figure \(\PageIndex{b}\)). Using this reasoning, all food eaten by humans can be traced back to producers that carry out photosynthesis.
Consumers can be classified based on whether they eat animal or plant material (figure \(\PageIndex{c}\)). Consumers that feed exclusively on animals are called carnivores. Lions, tigers, snakes, sharks, sea stars, spiders, and ladybugs are all carnivores. Herbivores are consumers that feed exclusively on plant material, and examples include deer, koalas, some bird species, crickets, and caterpillars. Consumers that eat both plant and animal material are considered omnivores. Humans, bears, chickens, cockroaches, and crayfish are examples of omnivores.
Dead producers and consumers are eaten by detritivores (which ingest dead tissues) and decomposers (which further break down these tissues into simple molecules by secreting digestive enzymes). Invertebrate animals, such as vultures, worms and millipedes are examples of detritivores, whereas fungi and certain bacteria are examples decomposers.
Food Chains
A food chain is a linear sequence of organisms through which nutrients and energy pass as one organism eats another. Each organism in a food chain occupies a specific trophic level (energy level), its position in the food chain. The first trophic level (TL) in the food chain is the producers. The primary consumers (the herbivores that eat producers) are the second trophic level. Next are higher-level consumers. Higher-level consumers include secondary consumers (third TL), which are usually carnivores that eat the primary consumers, and tertiary consumers (fourth TL), which are carnivores that eat other carnivores. In the Lake Ontario food chain, shown in figure \(\PageIndex{d}\), the Chinook salmon is the apex consumer at the top of this food chain. Some communities have additional trophic levels (quaternary consumers, fifth order consumers, etc.). Finally, detritivores and decomposers break down dead and decaying organisms from any trophic level. There is a single path through a food chain.
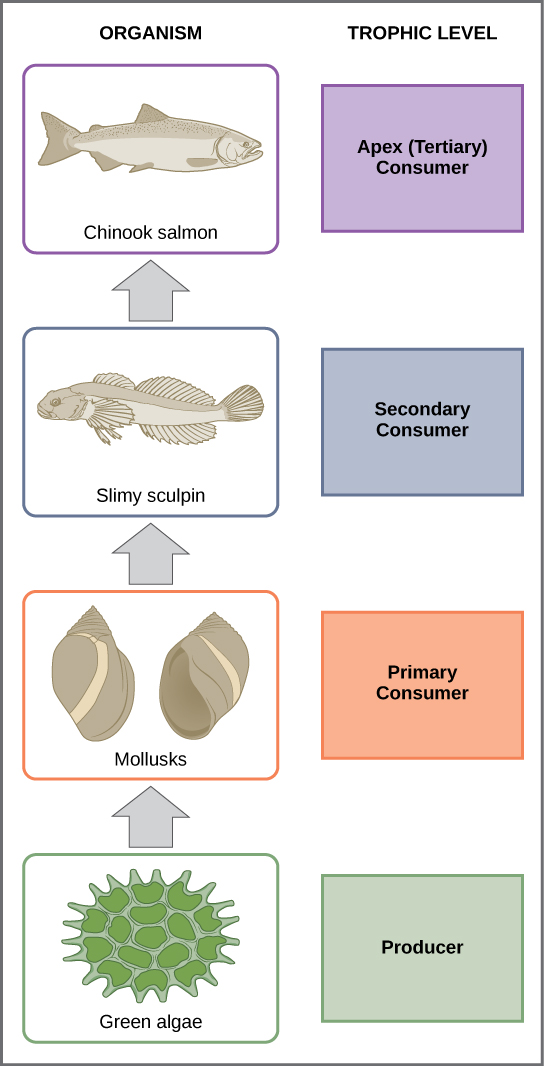
One major factor that limits the number of steps in a food chain is energy. Only about 10% of the energy in one trophic level is transferred to the next trophic level. This is because much energy is lost as heat during transfers between trophic levels or to decomposers due to the second law of thermodynamics. Thus, after four to six trophic energy transfers, the amount of energy remaining in the food chain may not be great enough to support viable populations at higher trophic levels
Certain environmental toxins can become more concentrated as they move up the food chain, with the highest concentrations occurring in the top consumers, a process called biomagnification. Essentially, a top consumer ingests all the toxins that had previously accumulated in the bodies of the organisms at the lower trophic levels. This explains why frequently eating certain fish, like tuna or swordfish, increases your exposure to mercury, a toxic heavy metal.
Food Webs
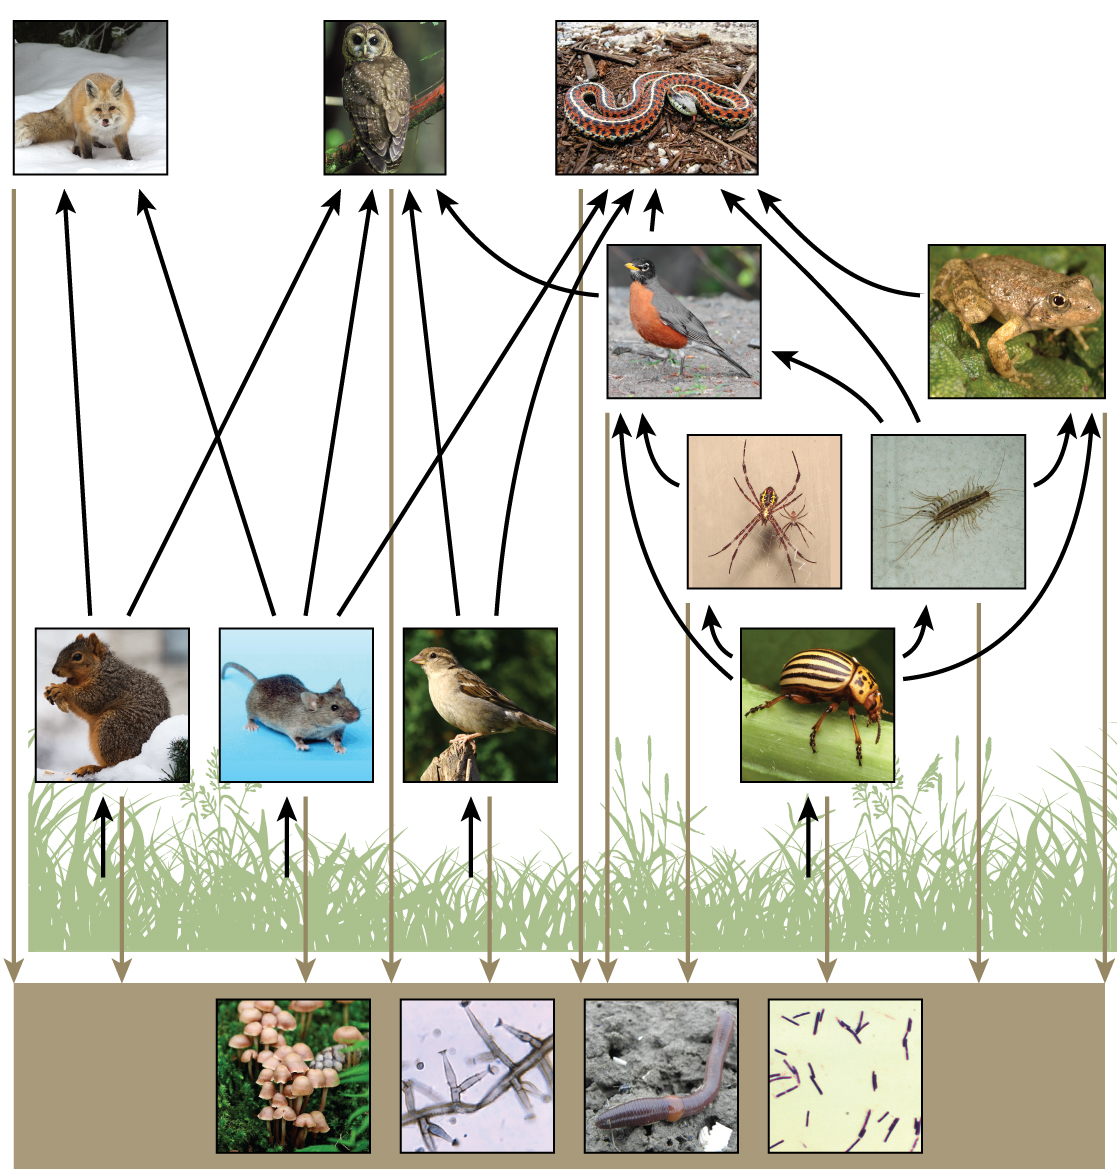
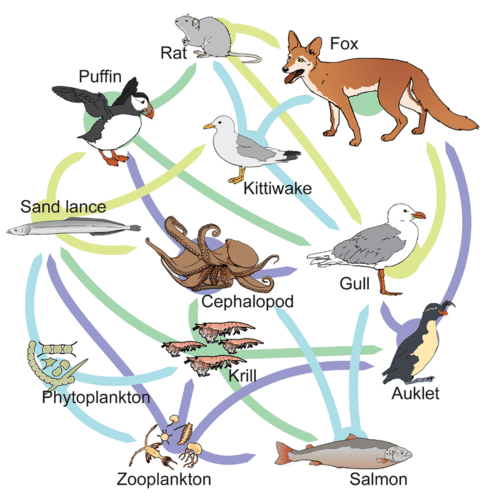
While food chains are simple and easy to analyze, there is a one problem when using food chains to describe most communities. Even when all organisms are grouped into appropriate trophic levels, some of these organisms can feed at more than one trophic level. In addition, species feed on and are eaten by more than one species. In other words, the linear model of trophic interactions, the food chain, is a hypothetical and overly simplistic representation of community structure. A holistic model—which includes all the interactions between different species and their complex interconnected relationships with each other and with the environment—is a more accurate and descriptive model. A food web is a concept that accounts for the multiple trophic interactions between each species (figure \(\PageIndex{e}\) and f).
Key Concept: Gross vs. Net Primary Productivity
- Gross Primary Productivity (GPP): The total energy captured by producers through photosynthesis.
- Net Primary Productivity (NPP): The energy remaining after producers use some for their own life processes.
- Why it matters: NPP determines how much energy is available to consumers and influences ecosystem productivity.
Energy Transfer, Food Webs, and Food Production
Only a small fraction of the energy available at one trophic level becomes biomass that can be used by the next trophic level. Much of the energy is lost as heat during metabolism, used for movement and other life processes, or released as waste. As a result, ecosystems contain less available energy at each higher trophic level. Ecologists estimate that, on average, only about 10% of the energy at one trophic level is transferred to the next, although the exact amount varies among ecosystems. This pattern is known as the 10% rule and helps explain why food webs typically contain fewer organisms at higher trophic levels (figure \(\PageIndex{g}\)).

The 10% rule also helps explain why producing animal-based foods often requires more resources than producing plant-based foods. Livestock consume large amounts of plant biomass, but only a portion of that energy is converted into animal tissue. Most of the energy is used for growth, movement, body maintenance, and heat production. Because energy is lost at each trophic transfer, producing meat generally requires more land, water, and feed than producing an equivalent amount of plant-based food.
Understanding energy transfer helps scientists evaluate the environmental impacts of food production and identify strategies that support more sustainable food systems.
Attribution
This page was heavily revised and rewritten by Erin Rempala and contains adapted content originally authored by Melissa Ha and Rachel Schleiger and is licensed CC BY-NC-SA 4.0.
Modified by Melissa Ha from the following sources:
- Energy, Energy Enters Ecosystems Through Photosynthesis, and Energy Flow Through Ecosystems from Environmental Biology by Matthew R. Fisher (licensed under CC-BY(opens in new window))
- Ecology of Ecosystems, Energy Flow through Ecosystems, and Digestive Systems(opens in new window) from General Biology/Biology 2e by OpenStax (licensed under CC-BY(opens in new window)). Access for free at openstax.org(opens in new window).
- Ecosystem Productivity from Biology by John W. Kimball (licensed under CC-BY(opens in new window))
This page titled 3.3.4: Energy Flow in Food Webs was last modified on Tue, 28 Jul 2026 13:33:56 GMT and is shared under a CC BY-NC-SA 4.0 license and was authored, remixed, and/or curated by Melissa Ha and Rachel Schleiger (ASCCC Open Educational Resources Initiative) .
The book could not be loaded just now.