Opening the book…
Waste in Natural and Human Systems
In natural ecosystems, there is no such thing as "waste." Matter and nutrients continuously cycle through biological and geological processes. Dead organisms are decomposed by fungi, bacteria, and detritivores, and the materials they contain become nutrients that support new life. In this sense, ecosystems operate as largely circular systems in which materials are continually reused.
Human societies often function differently. Many modern economies follow a linear model in which materials are extracted, manufactured into products, used, and then discarded (figure \(\PageIndex{a}\)). This "take-make-waste" approach generates large quantities of solid waste, the discarded materials that humans consider no longer useful or valuable.
Many products are designed to be durable, resistant to decomposition, or difficult to repair or recycle. As a result, materials that could potentially be reused often accumulate in landfills, waterways, and the environment. However, what is considered waste in one context may be a valuable resource in another. Increasingly, scientists, engineers, and policymakers are exploring ways to reduce waste and keep materials in circulation through reuse, repair, recycling, composting, and circular-economy strategies.
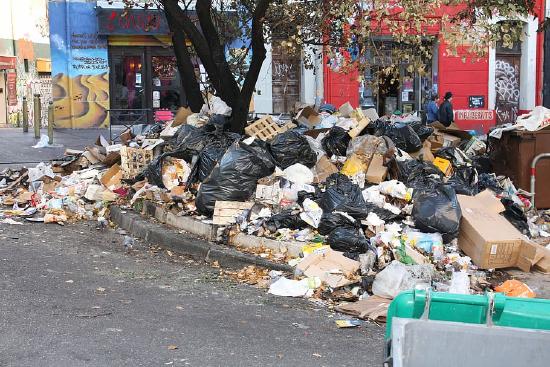
The quantity and composition of waste provide insights into how societies use materials and energy. Examining where waste comes from and what it is made of can help identify opportunities to reduce waste and move toward more circular systems.
Think About It
A fallen tree in a forest is eventually decomposed and recycled into the ecosystem. Why do many human-made materials accumulate as waste instead of being reused in the same way?
Types of Solid Waste
Solid waste includes many different materials with varying environmental impacts.
Some materials are biodegradable, meaning they can be broken down by microorganisms into simpler substances. Food scraps, paper, yard trimmings, and untreated wood are examples of biodegradable wastes (figure \(\PageIndex{b}\)).
Other materials are nondegradable or break down very slowly. Plastics, synthetic fabrics, glass, and many manufactured products may persist in the environment for decades or centuries.
Particular attention is often given to hazardous waste, which includes materials that are toxic, carcinogenic (cause cancer), mutagenic (cause DNA mutations), teratogenic (cause birth defects), highly flammable, corrosive, reactive, or explosive. Because these substances can pose risks to human health and ecosystems, they often require specialized handling, recycling, and disposal procedures.
Common examples include batteries, fluorescent bulbs, solvents, paints, pesticides, and discarded electronic devices.
Electronic waste, or e-waste, is one of the fastest-growing waste streams globally. Although electronics often contain valuable materials such as copper, gold, silver, and rare earth elements, they may also contain hazardous substances that require specialized recycling and disposal methods.

Where Does Waste Come From?
When many people think about waste, they think about trash cans, recycling bins, and landfills. However, household garbage represents only a small portion of total waste generation.
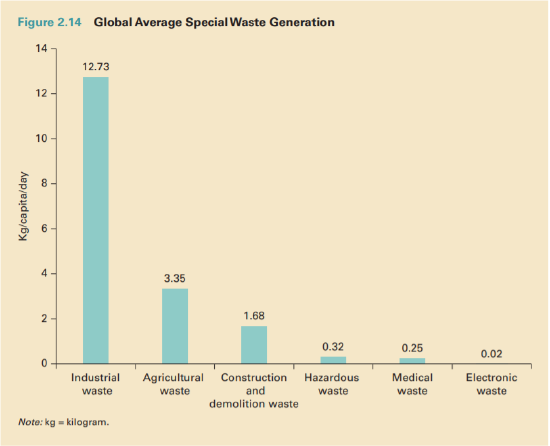
Globally, agriculture, industry, construction, mining, and energy production generate far more waste than households. These waste streams are collectively known as non-municipal solid waste and include materials such as mining residues, construction debris, industrial byproducts, wastewater-treatment sludge, and agricultural wastes.
The waste generated by homes, businesses, schools, and local governments is called municipal solid waste (MSW). Although MSW receives considerable attention because people interact with it daily, it accounts for only a small fraction of total waste generation (figure \(\PageIndex{c}\)).
Municipal Solid Waste
The world generates more than 2 billion metric tons (2 trillion kg) of municipal solid waste each year, and waste generation is projected to continue increasing as populations grow, urbanization expands, and consumption rises. In the United States, municipal solid waste generation averages about 4.9 pounds (2.2 kg) per person per day, among the highest rates in the world.
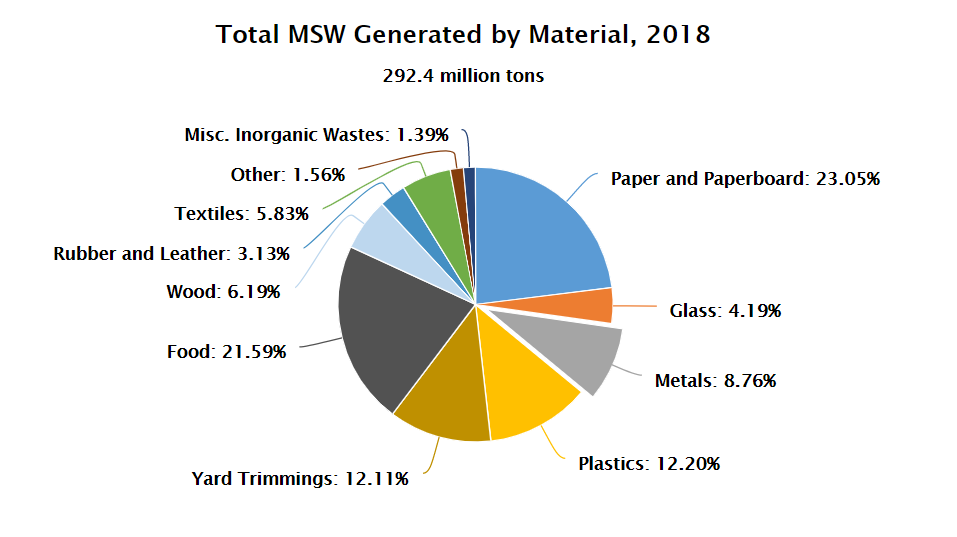
Municipal solid waste includes a diverse mix of materials, including paper and cardboard, food waste, plastics, yard trimmings, metals, glass, wood, and textiles. Although the composition of waste varies among communities, studies consistently show that a large fraction of municipal waste could potentially be reduced, reused, repaired, recycled, or composted rather than being disposed of in landfills.
This observation highlights an important challenge in waste management: many materials currently treated as waste still retain value and could remain in use through more circular approaches to production and consumption.
What Happens to Municipal Solid Waste?
The composition of municipal solid waste provides insight into what communities throw away, but it does not reveal what happens to those materials after disposal. Some materials are recycled, composted, or used to recover energy, while others are landfilled or incinerated.
Comparing the composition of municipal solid waste with the materials that are recovered through recycling and composting reveals important patterns. Some materials, such as paper and cardboard, are recycled at relatively high rates because collection systems and markets for recycled paper are well established. Metals are also commonly recycled because they retain significant economic value. In contrast, plastics make up a large fraction of the waste stream but are recycled at much lower rates. Food waste and yard trimmings can be composted, yet substantial quantities are still disposed of in landfills.
The two pie charts in figure (\(\PageIndex{d}\)) compare the composition of municipal solid waste generated in the United States with the materials recovered through recycling and composting. Together, these figures illustrate an important principle of waste management: materials that enter the waste stream do not all have the same likelihood of being recovered. Understanding why some materials are successfully recycled while others are commonly discarded can help identify opportunities to reduce waste and move toward a more circular economy.

Think About It
Compare the pie charts in Figure (\(\PageIndex{d}\)). Which materials appear to be recycled or composted at high rates relative to the amount generated? Which materials are underrepresented in the recycling stream? What factors might explain these differences?
Attribution
This page was heavily revised and rewritten by Erin Rempala and contains adapted content from content originally authored by Melissa Ha and Rachel Schleiger and is licensed CC BY-NC-SA 4.0.
Modified by Melissa Ha from the following sources:
- Systems of Waste Management from Sustainability: A Comprehensive Foundation by Tom Theis and Jonathan Tomkin, Editors (CC-BY). Download for free at CNX.
- Solid Waste form AP Environmental Science by University of California College Prep (CC-BY). Download for free at CNX.
- Kaza, Silpa; Yao, Lisa C.; Bhada-Tata, Perinaz; Van Woerden, Frank. 2018. What a Waste 2.0 : A Global Snapshot of Solid Waste Management to 2050. Urban Development;. Washington, DC: World Bank. © World Bank. (CC-BY)
This page titled 11.1: Waste Generation was last modified on Sat, 12 Sep 2026 17:31:00 GMT and is shared under a CC BY-NC-SA 4.0 license and was authored, remixed, and/or curated by Melissa Ha and Rachel Schleiger (ASCCC Open Educational Resources Initiative) .
The book could not be loaded just now.